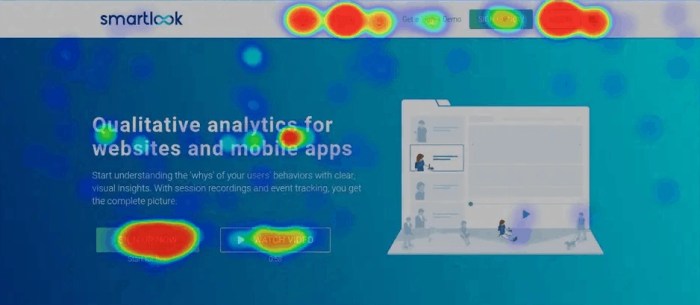
Understanding Website Heatmaps dives deep into the world of web analytics, shedding light on how these tools optimize user experience. From click maps to scroll maps, this topic explores it all with a fresh perspective.
Get ready to uncover the secrets behind user engagement and conversion rates like never before.
Introduction to Website Heatmaps

Website heatmaps are visual tools that provide a graphical representation of user behavior on a website. These tools are used in web analytics to track and analyze how users interact with a website, helping businesses gain insights into user behavior and preferences.
Understanding website heatmaps is crucial for optimizing user experience as it allows website owners to identify areas of improvement, such as optimizing page layout, navigation, and call-to-action buttons. By analyzing website heatmaps, businesses can make data-driven decisions to enhance the overall user experience and increase user engagement.
Types of Website Heatmaps
- Click Maps: Show where users click the most on a webpage, highlighting popular areas and elements.
- Scroll Maps: Display how far down the page users scroll before leaving, indicating the effectiveness of content placement.
- Mouse Movement Maps: Track the movement of the mouse cursor, providing insights into user attention and behavior.
Website heatmaps offer significant benefits for improving conversion rates and user engagement. By analyzing user interactions, businesses can optimize their website design, content, and functionality to enhance user experience, increase conversions, and ultimately drive business growth.
Types of Website Heatmaps: Understanding Website Heatmaps

Website heatmaps come in various types, each offering unique insights into user behavior on a website. Let’s dive into the different types of heatmaps and how they can be utilized for optimizing website performance.
Click Maps
Click maps provide visual representations of where users are clicking on a website. By tracking the areas that receive the most clicks, website owners can identify popular features, buttons, or links. This information helps in optimizing the layout and design to enhance user engagement. For example, click maps can be used to analyze the effectiveness of call-to-action buttons or navigation menus.
Scroll Maps
Scroll maps show how far down a page users scroll before leaving. This type of heatmap helps in understanding user engagement and content visibility. By identifying where users are dropping off, website owners can adjust the placement of important information to keep users engaged throughout the page. Scroll maps are useful for optimizing content layout and improving user experience.
Attention Maps, Understanding Website Heatmaps
Attention maps indicate the areas of a webpage that receive the most attention from users. By analyzing where users focus their attention, website owners can optimize the placement of key elements such as images, text, or videos. Attention maps are valuable for enhancing the visual hierarchy of a webpage and improving overall user engagement.
Each type of heatmap offers valuable insights into user behavior and can be used based on specific goals or metrics. However, it is important to note that each type of heatmap has its limitations. Click maps may not capture hover interactions, scroll maps may not account for quick scrolling behavior, and attention maps may not reflect actual user engagement. To overcome these limitations, it is recommended to use a combination of different types of heatmaps and conduct further user testing for a comprehensive understanding of website performance.
Interpreting Website Heatmaps
When it comes to interpreting website heatmaps, it’s important to understand how to extract meaningful insights from the data presented. By analyzing common patterns and trends found in website heatmaps, you can uncover valuable information that can help improve the overall user experience of your website.
Common Patterns and Trends
- One common pattern found in website heatmaps is the “hot spot” where users tend to focus their attention the most. This area typically indicates high user engagement and should be optimized for conversion.
- Conversely, areas with little to no activity, known as “cold spots,” may indicate areas of low user engagement that need improvement or redesign.
- Scroll maps can reveal how far users are scrolling down a page, helping to identify where content may be getting overlooked or ignored.
Identifying Areas of Engagement
- Look for areas with high click density, indicating where users are clicking the most. This can help prioritize important elements on the page and improve the overall user experience.
- Pay attention to areas with high hover activity, as this may indicate areas of interest or confusion that need further investigation.
Translating Data into Actionable Improvements
- Use heatmap data to make informed decisions about website design and layout changes that can enhance user engagement and interaction.
- Experiment with different variations based on heatmap insights to see which improvements have the most positive impact on user behavior.
Implementing Website Heatmaps
Implementing website heatmaps is crucial for gaining valuable insights into user behavior and optimizing website performance. Below are some steps on how to set up website heatmaps using popular tools like Hotjar, Crazy Egg, or Google Analytics.
Setting up Website Heatmaps
- Choose a heatmap tool: Select a heatmap tool that best fits your needs and budget, such as Hotjar, Crazy Egg, or Google Analytics.
- Install the tracking code: Follow the instructions provided by the chosen tool to install the tracking code on your website.
- Set up heatmap configurations: Customize the heatmap settings to track specific elements on your website, such as clicks, scrolls, or mouse movements.
Technical Requirements
- Compatible website platform: Ensure that your website platform supports the installation of heatmap tracking codes.
- Access to website files: You may need access to the backend of your website to implement the tracking code properly.
- Testing and debugging: Test the heatmap tracking code to ensure accurate data collection and troubleshoot any issues that may arise.
Ensuring Accurate Data Collection
- Regular monitoring: Keep an eye on your heatmap data regularly to identify any anomalies or trends that may require further analysis.
- Segmentation: Use segmentation features to analyze specific user groups or behaviors for more targeted insights.
- Combine with other analytics: Integrate heatmap data with other analytics tools to get a comprehensive view of user interactions on your website.
Successful Website Heatmap Implementations
- Improving user experience: By analyzing heatmap data, websites have successfully optimized their layout and content to enhance user experience and increase engagement.
- Increasing conversions: Heatmaps have helped businesses identify areas of high user engagement and optimize them for better conversion rates, resulting in increased sales and leads.
- Reducing bounce rates: Understanding user behavior through heatmaps has allowed websites to reduce bounce rates by addressing issues like confusing navigation or unappealing content.